ESG Reporting · Enterprise SaaS
Rita One
Enterprise ESG reporting that turns scattered data into an audit-ready story.

01
Overview
RITA (ESG Reporting Tool) helps large industrial groups collect, verify and report sustainability data across every legal entity they own. A single group may span multiple countries, each with its own sites, collectors, approvers and reporting frameworks. Before RITA, that work lived in spreadsheets emailed between plants and headquarters. My brief was to turn a compliance obligation into a workflow product: clear ownership per data point, visible progress against the deadline, and reports that trace back to who entered what.
- Role
- Lead UI/UX Designer — research, IA, workflow design, UI system, theming, handoff
- Timeline
- 7 months (discovery → design system → phased rollout)
- Tools
- Figma, FigJam, Figma Dev Mode, Maze, Confluence, Jira
- Platform
- Responsive enterprise web application, light and dark themes
02
The problem
- The org structure is deeply nested — group, country entity, site — and every data point, permission and report rolls up through it, so the hierarchy had to be visible and editable, not hidden in settings.
- Two very different personas share the product: collectors who fill in a handful of themes, and admins/approvers who need portfolio-wide oversight.
- Emission factors, frameworks (ESRS, GRI) and reporting regions are reference data that change annually, so screens had to be driven by configurable master data rather than hardcoded fields.
- Every value needs an audit trail — assigned, in progress, approved, locked — because disclosures are externally assured.
- Enterprise IT required both light and dark themes plus per-client brand theming without forking the UI.
03
Discovery
Discovery with ESG teams
Interviewed sustainability managers, plant-level collectors and group reporting leads, then mapped a full reporting cycle end to end. The recurring pain was never data entry itself — it was chasing who owed what, and proving where a number came from.
04
Define
The design direction focused on these documented product decisions:
The org structure is deeply nested — group, country entity, site — and every data point, permission and report rolls up through it, so the hierarchy had to be visible and editable, not hidden in settings.
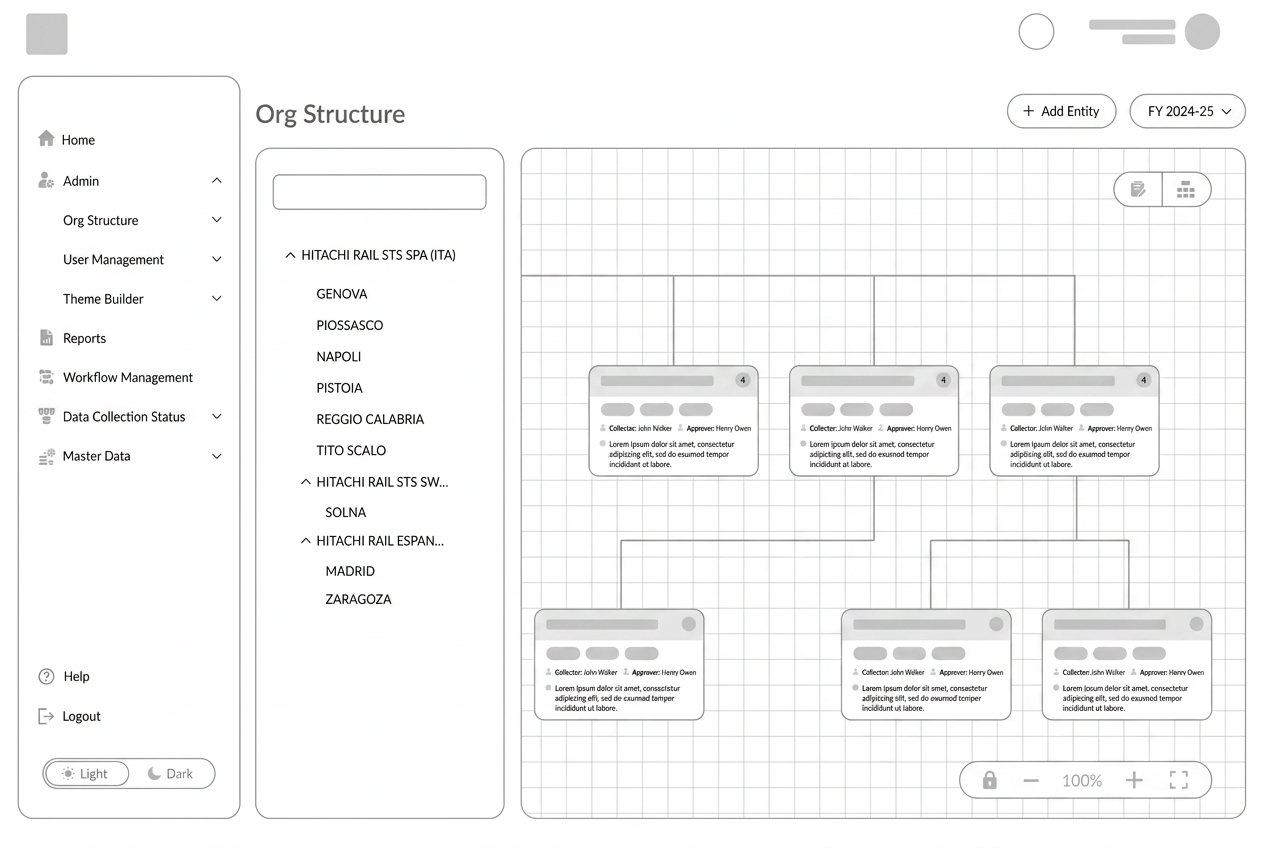
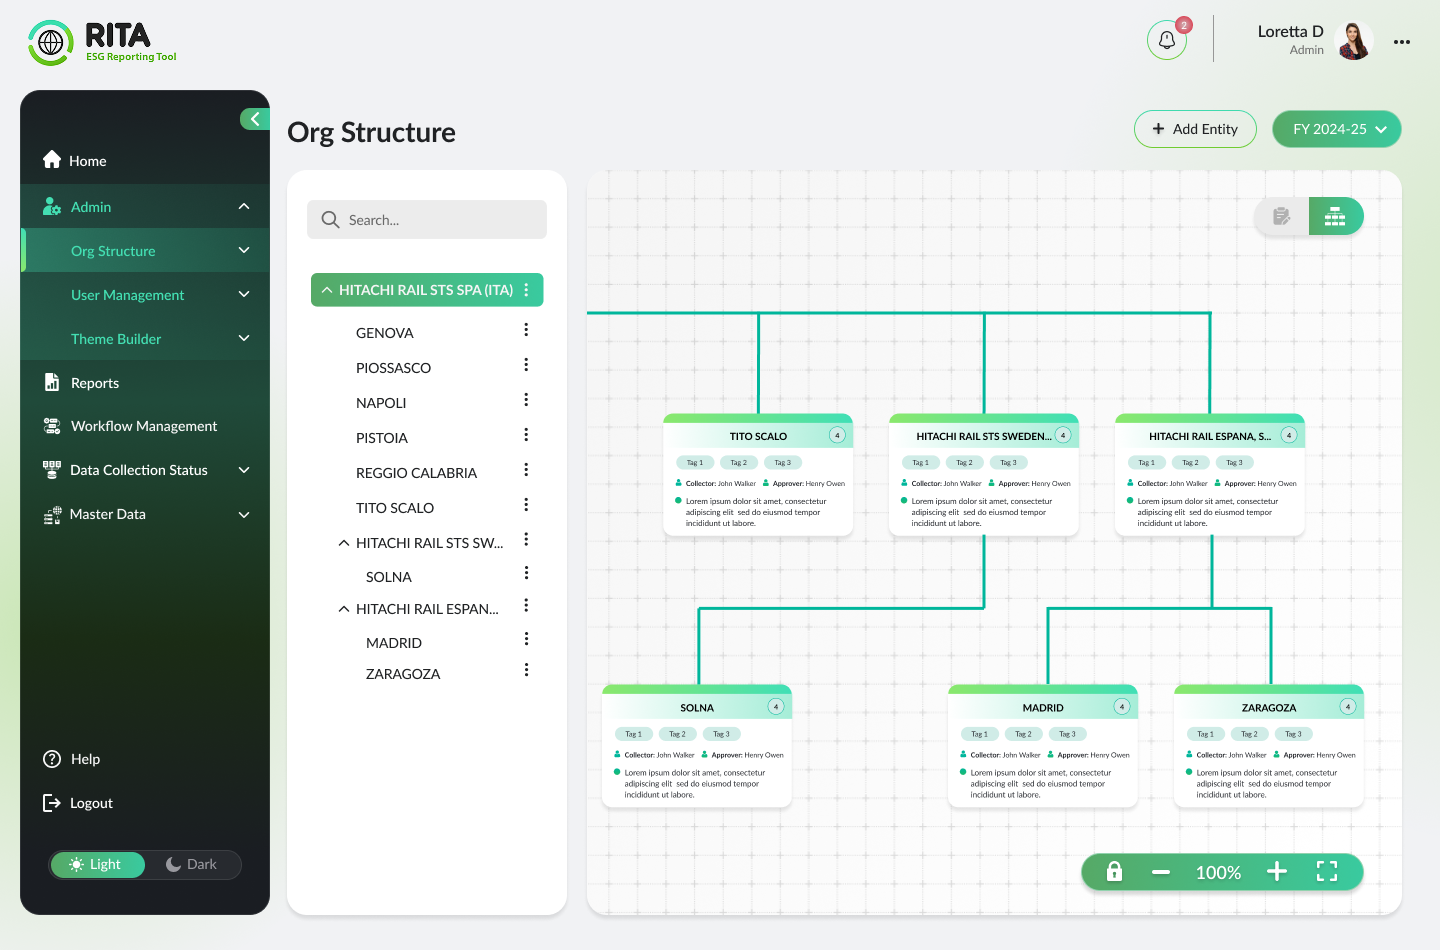
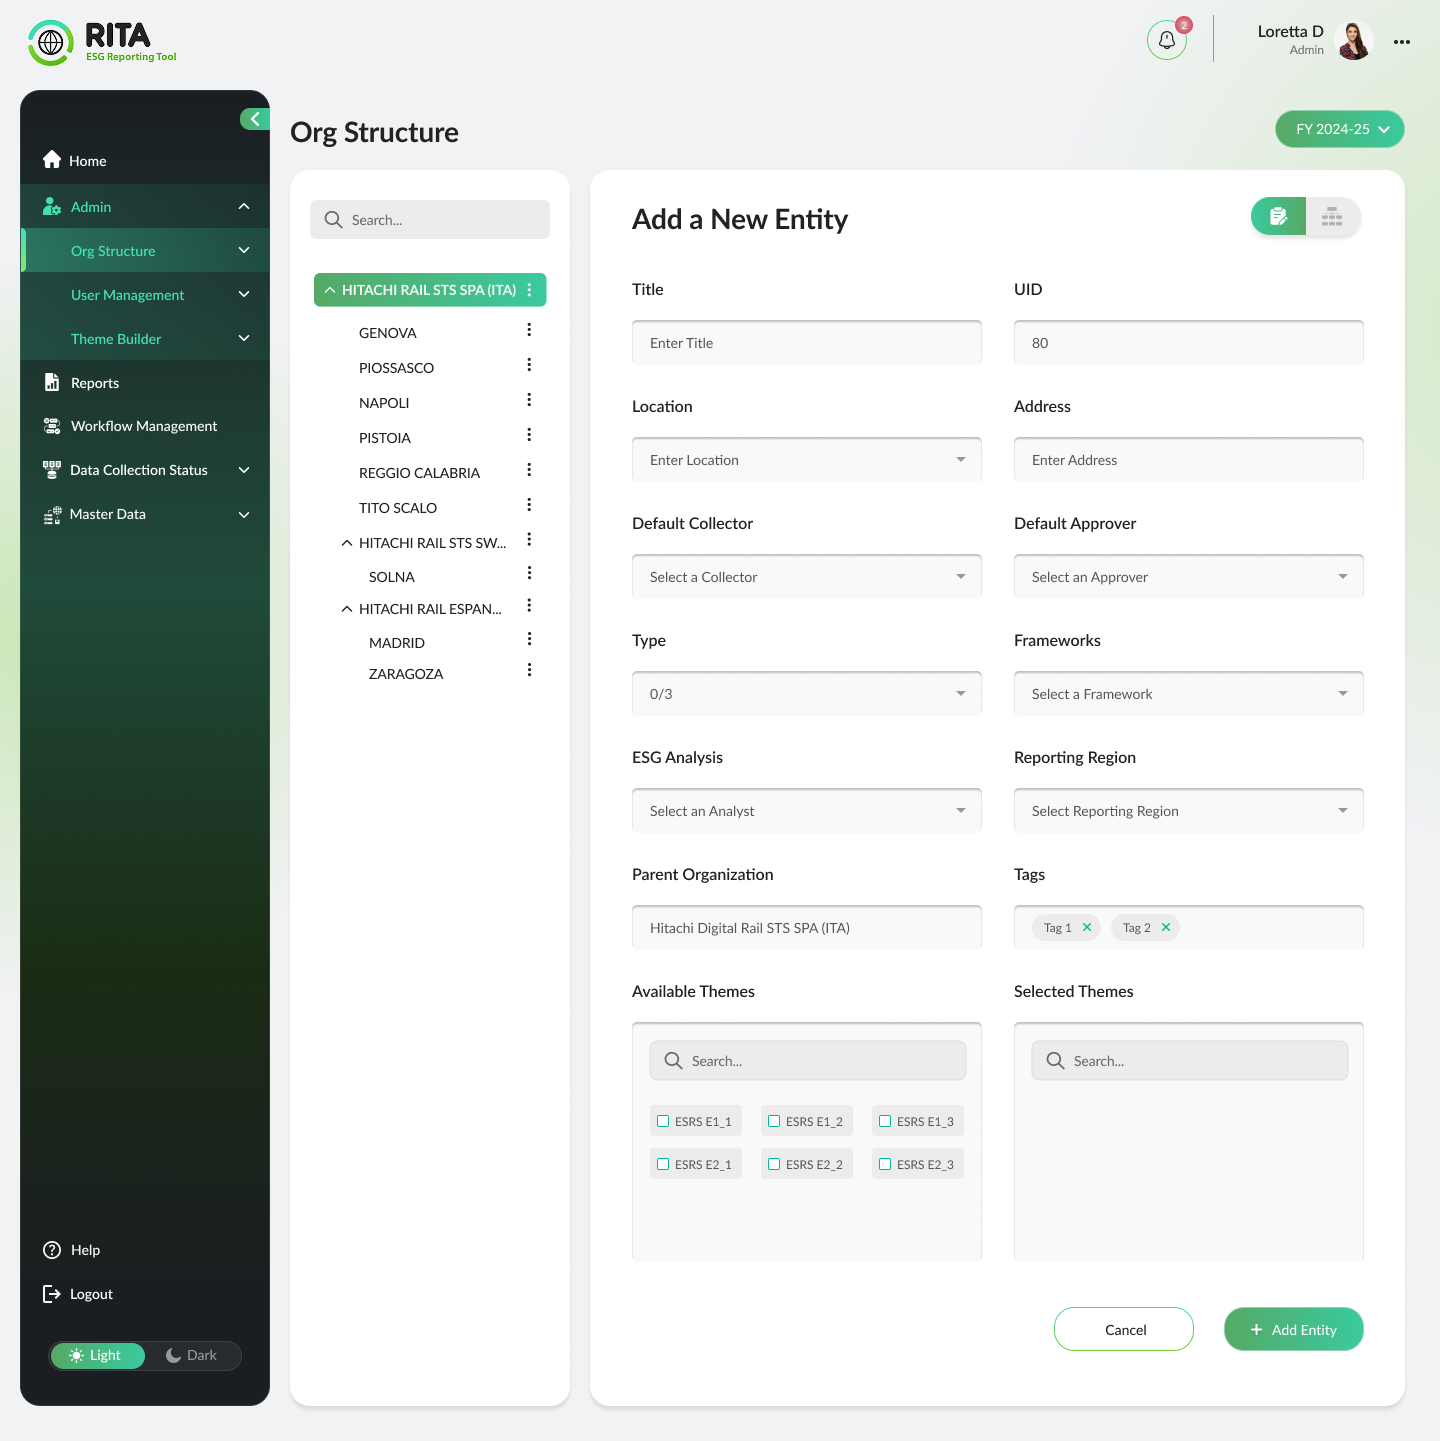
A synchronised tree and zoomable chart let admins see the whole group, add an entity inline, and assign default collector and approver at the point of creation — so ownership exists before collection starts.
Two very different personas share the product: collectors who fill in a handful of themes, and admins/approvers who need portfolio-wide oversight.
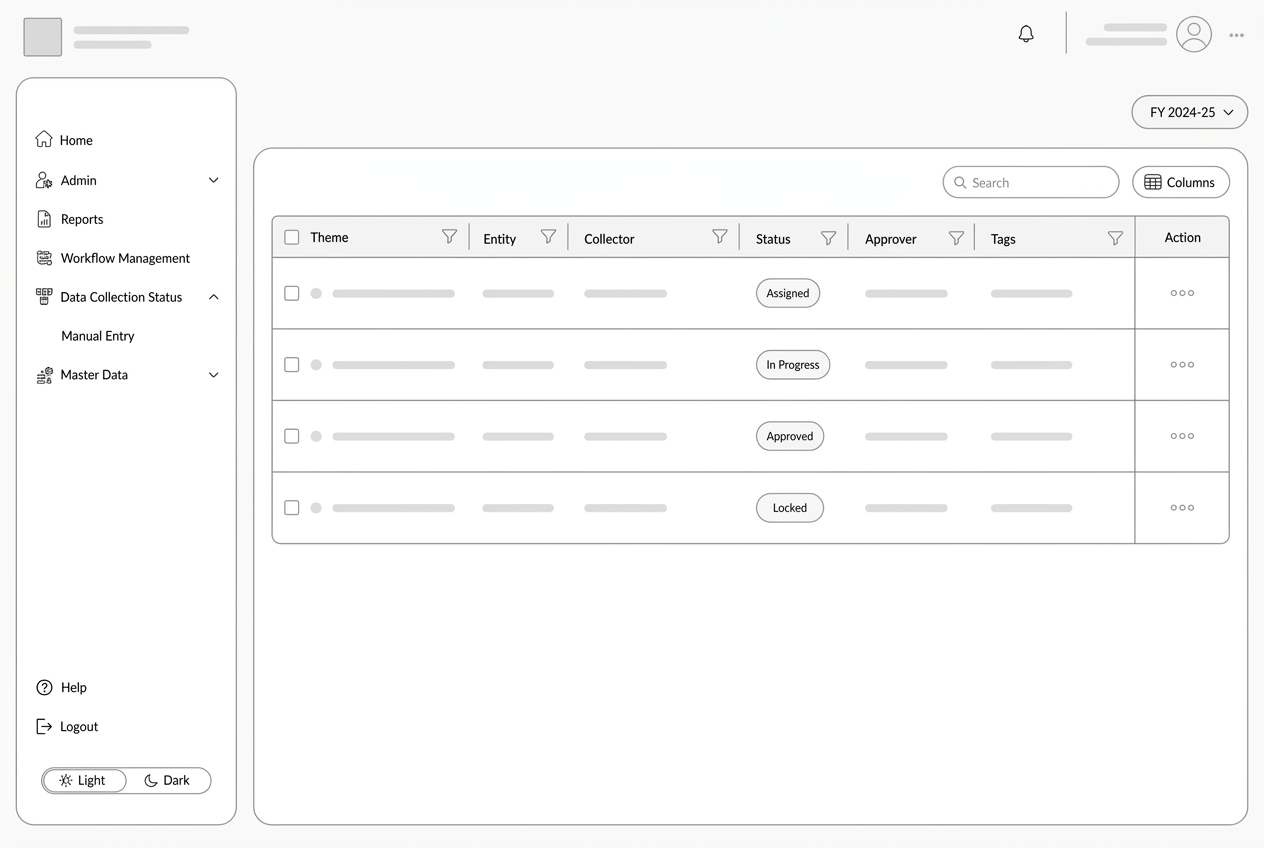
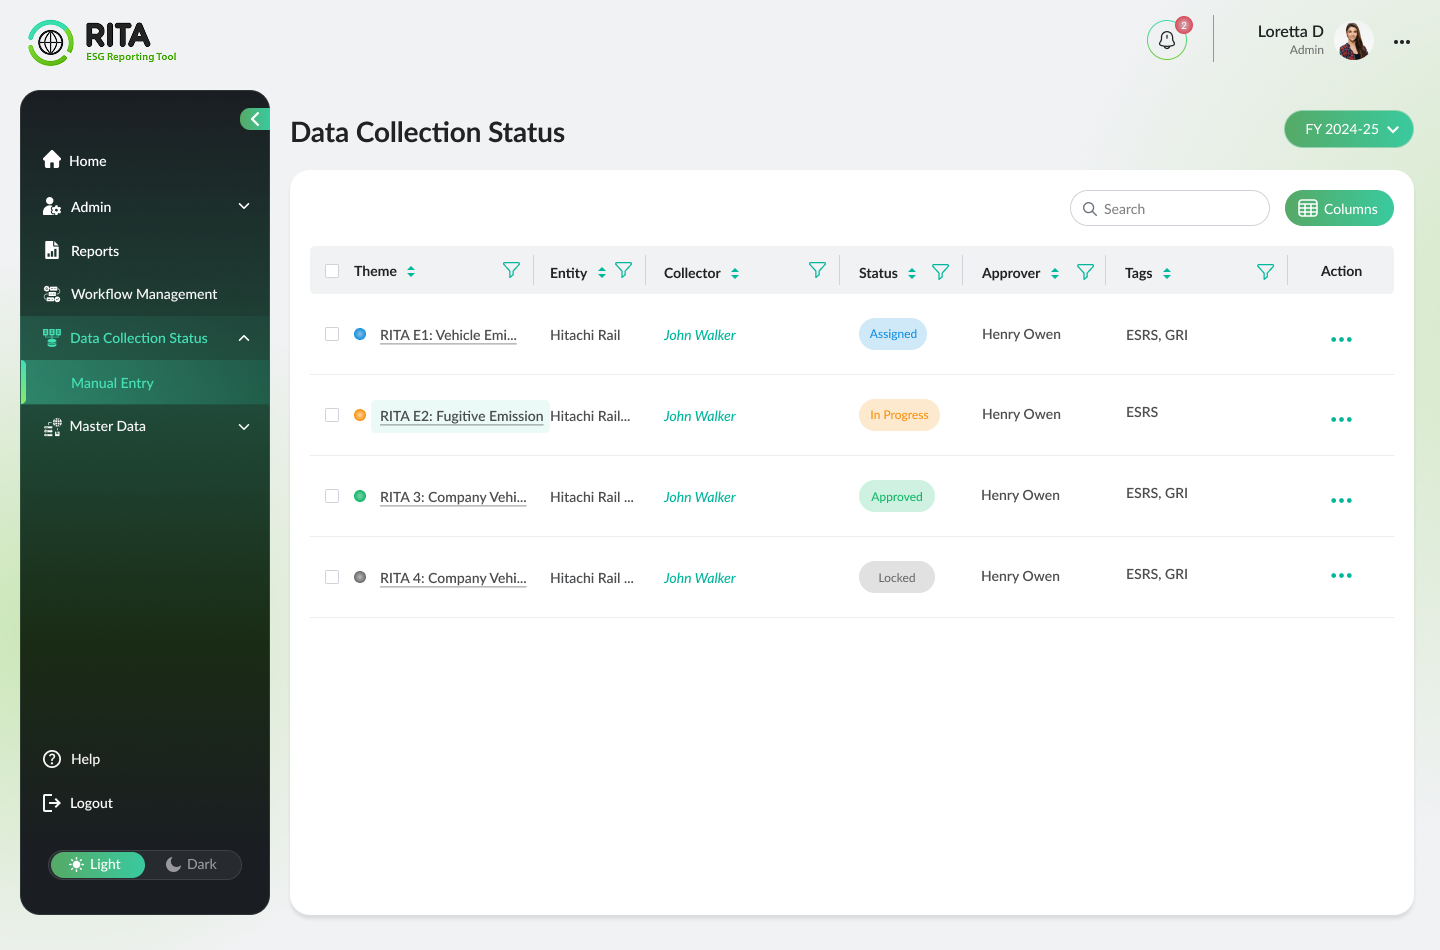
Assigned, In Progress, Approved and Locked chips make the state of hundreds of theme–entity pairs readable at a glance, with filters on every column to isolate exactly what is blocking the deadline.
Emission factors, frameworks (ESRS, GRI) and reporting regions are reference data that change annually, so screens had to be driven by configurable master data rather than hardcoded fields.
The Add Entity form pairs identity fields with governance fields — frameworks, reporting region, analyst, tags — and a dual-list theme picker, so a new site is fully configured in one pass instead of five settings screens.
Every value needs an audit trail — assigned, in progress, approved, locked — because disclosures are externally assured.
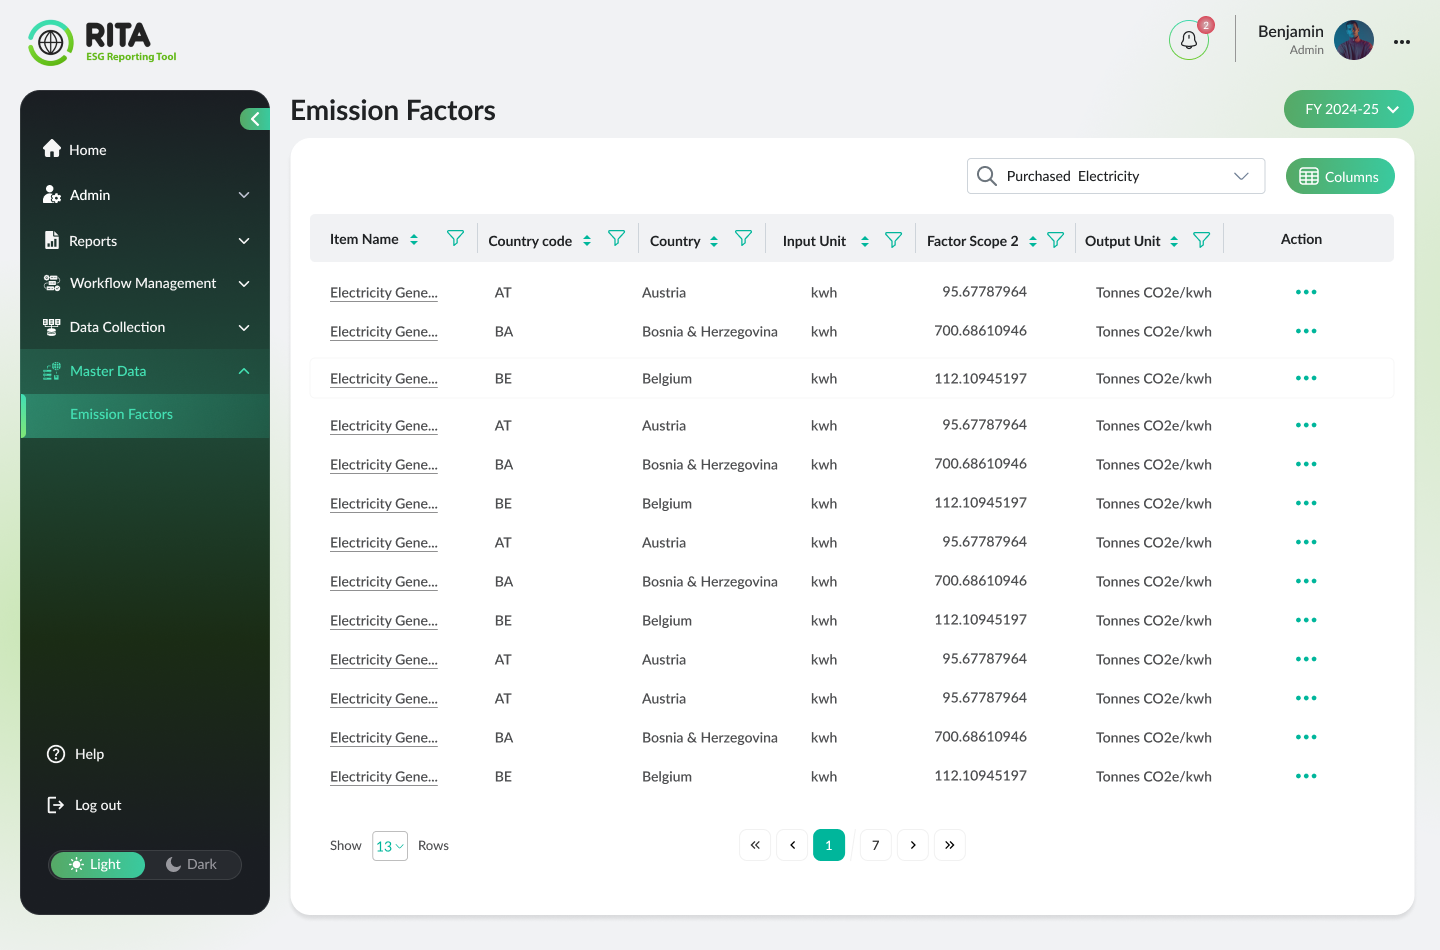
Emission factors are managed in-product with country, unit and scope columns, so calculations reference one governed dataset rather than per-plant spreadsheet copies.
Enterprise IT required both light and dark themes plus per-client brand theming without forking the UI.
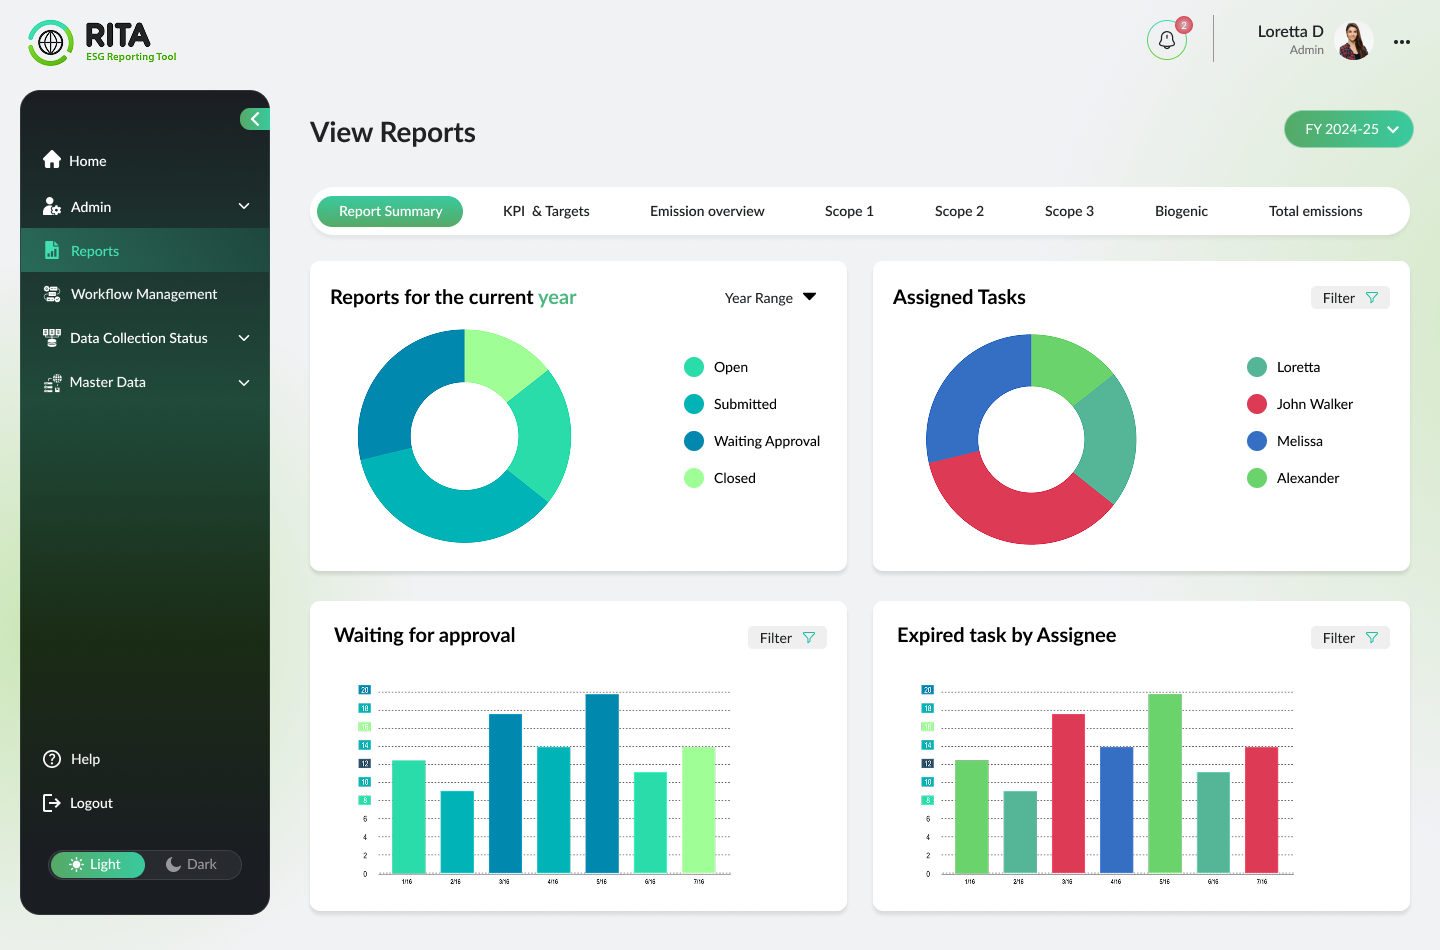
Every chart reads the live collection state, so the report view doubles as a progress dashboard — open, submitted, waiting approval, closed — instead of a separate end-of-quarter export.
05
Design process
01
Modelling the org structure
Made the entity hierarchy a first-class screen: a searchable tree paired with a zoomable org chart, each node carrying its collector, approver, tags and themes. Every downstream permission and rollup derives from this model.
02
Workflow & status system
Defined the lifecycle of a data point — Assigned, In Progress, Approved, Locked — with colour and label pairs so status is never carried by colour alone. Approvals, reassignment and locking all hang off this one vocabulary.
03
One data table, everywhere
Designed a single configurable table used by data collection, master data and emission factors: per-column sort and filter, a column manager, search, pagination and row-level actions. Users learn it once and it behaves identically across the product.
04
Reporting & visualisation
Built a tabbed reporting layer — summary, KPIs and targets, emission overview, Scope 1/2/3, biogenic, totals — with donut and bar charts that answer 'what is still open' and 'who is behind' before drilling into detail.
06
Validation & handoff
Theming, accessibility & handoff
Tokenised colour, spacing and typography for light/dark and a Theme Builder for client branding, held WCAG AA contrast on every state, and documented all components in Dev Mode with responsive rules.
07
Final UI / key screens
08
Outcome & reflection
Documented project outputs
- 3 levels — Group → entity → site modelled
- 4 states — Auditable data lifecycle
- ESRS + GRI — Frameworks supported
- Light + dark — Themeable design system
In compliance software, trust beats speed. The features people valued most were the unglamorous ones — a visible owner for every data point and a status that never lies — because a report is only as useful as the confidence that its numbers can be defended.