Traceability · Sustainability SaaS
ImpactTrace
Digital Product Passports that make a supply chain legible end to end.
01
Overview
ImpactTrace lets manufacturers register a product, model its life-cycle impact, issue traceable labels and publish a Digital Product Passport that anyone can scan. The domain is dense — bills of materials, ReCiPe impact methods, emission flows, custody handovers — and the users are operations and sustainability staff, not analysts. My job was to make a regulated, data-heavy workflow feel like filling in a form and reading a receipt.
- Role
- Lead UI/UX Designer — research, IA, flows, data visualization, UI system, handoff
- Timeline
- 7 months (discovery → MVP → rollout)
- Tools
- Figma, FigJam, Figma Dev Mode, Maze, Jira
- Platform
- Responsive web app + public Digital Product Passport
02
The problem
- Creating one product touches six distinct data domains; asking for all of it on one screen was unusable, but splitting it risked people abandoning halfway.
- LCA output is scientific — UUIDs, acidification, DCB-eq, MJ-eq — and had to stay accurate while remaining readable to non-specialists.
- Traceability spans companies: each handover (plant, transport, warehouse) needed a timestamp, a location and an exception state without turning into a wall of logs.
- The same underlying record serves two very different audiences: an internal operator building it, and a consumer scanning a QR code.
- Partner data arrives incomplete, so every screen needed honest empty, pending and 'critical event' states.
03
Discovery
Discovery & domain mapping
Sat with sustainability leads and plant operators to map how a product record is really assembled today — spreadsheets from suppliers, an LCA tool export, and PDFs from logistics. I mapped every field to its true owner, which later decided the order of the wizard steps.
04
Define
The design direction focused on these documented product decisions:
Creating one product touches six distinct data domains; asking for all of it on one screen was unusable, but splitting it risked people abandoning halfway.
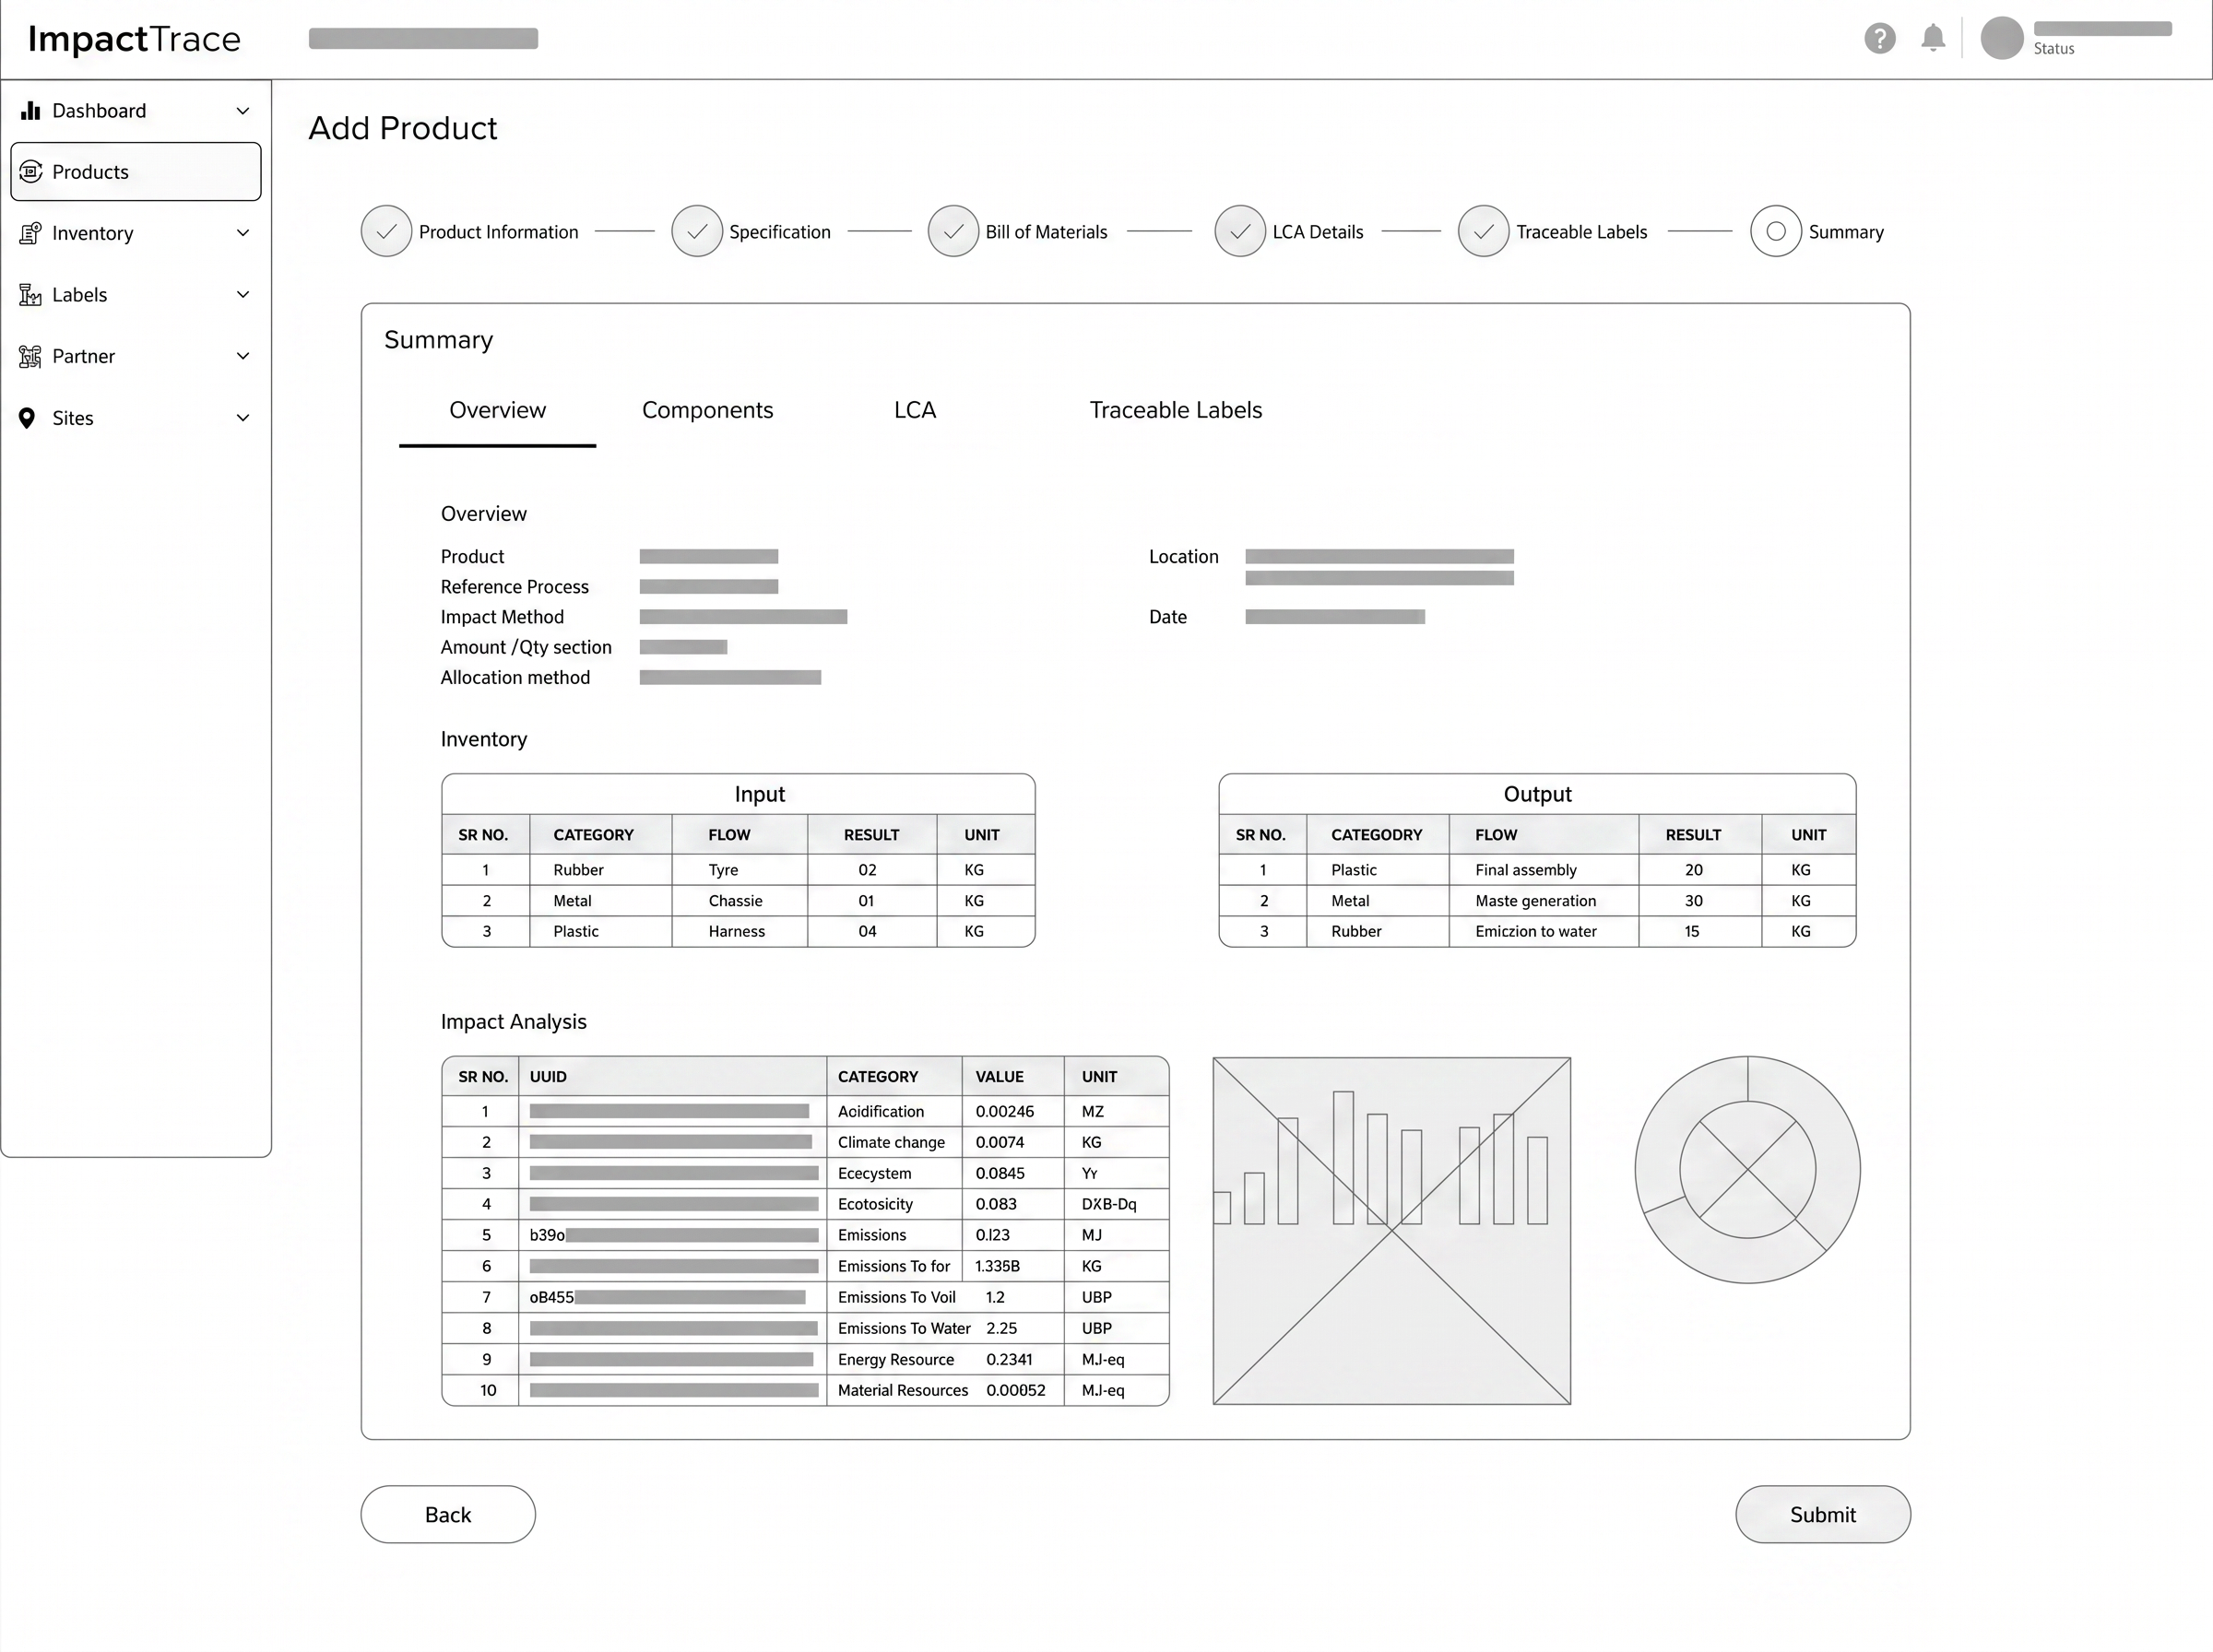
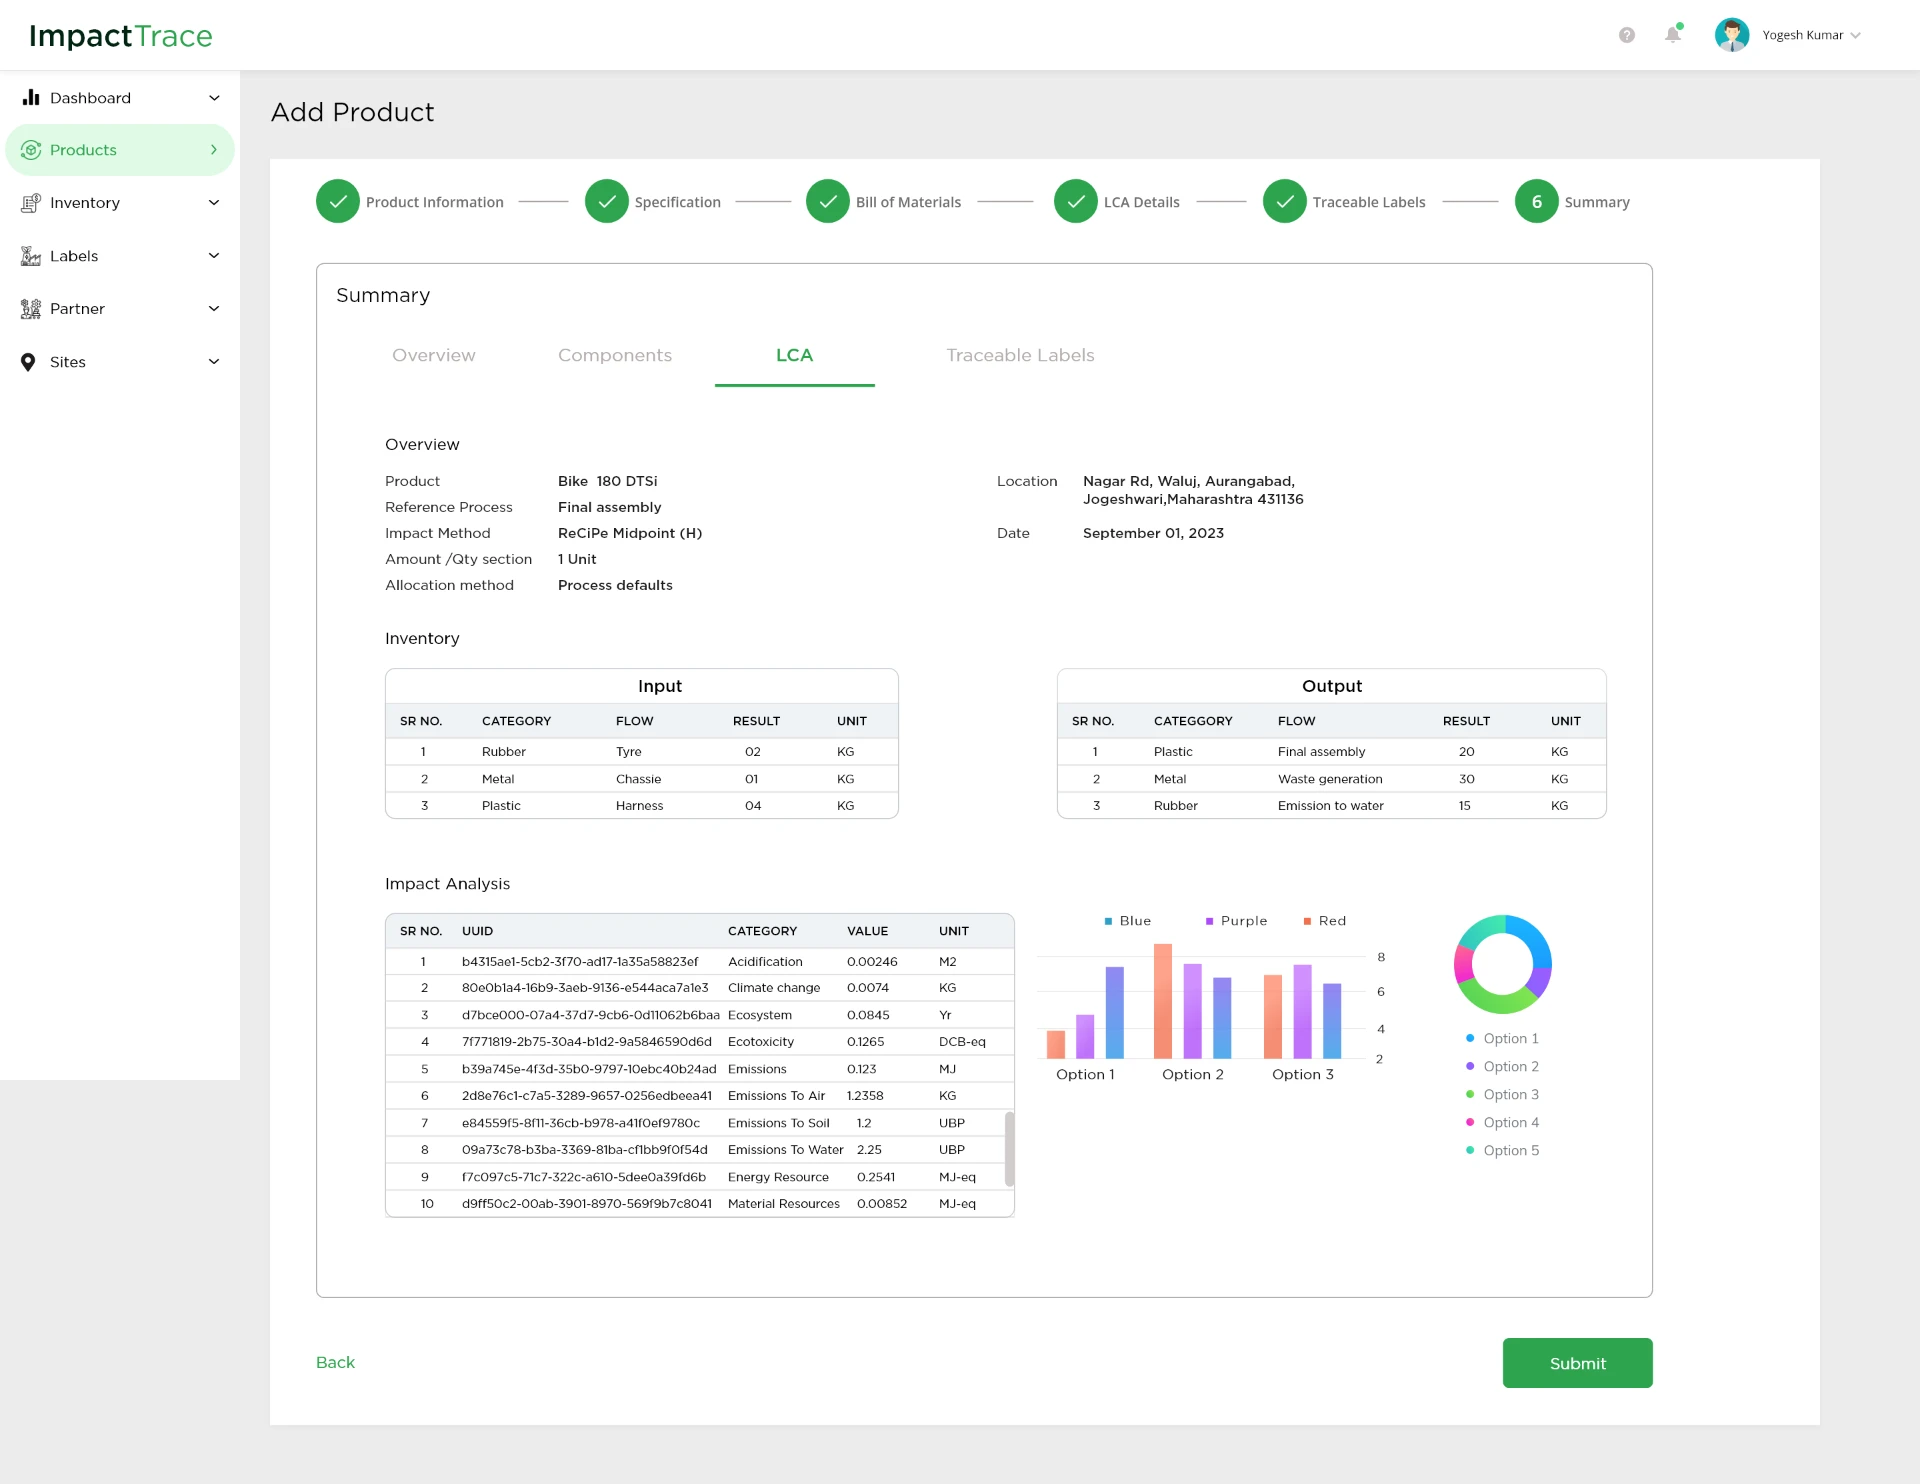
Each step owns one data domain and saves independently; the Summary tabs (Overview, Components, LCA, Traceable Labels) let a user verify everything in one place before submitting, which removed the fear of an irreversible mistake.
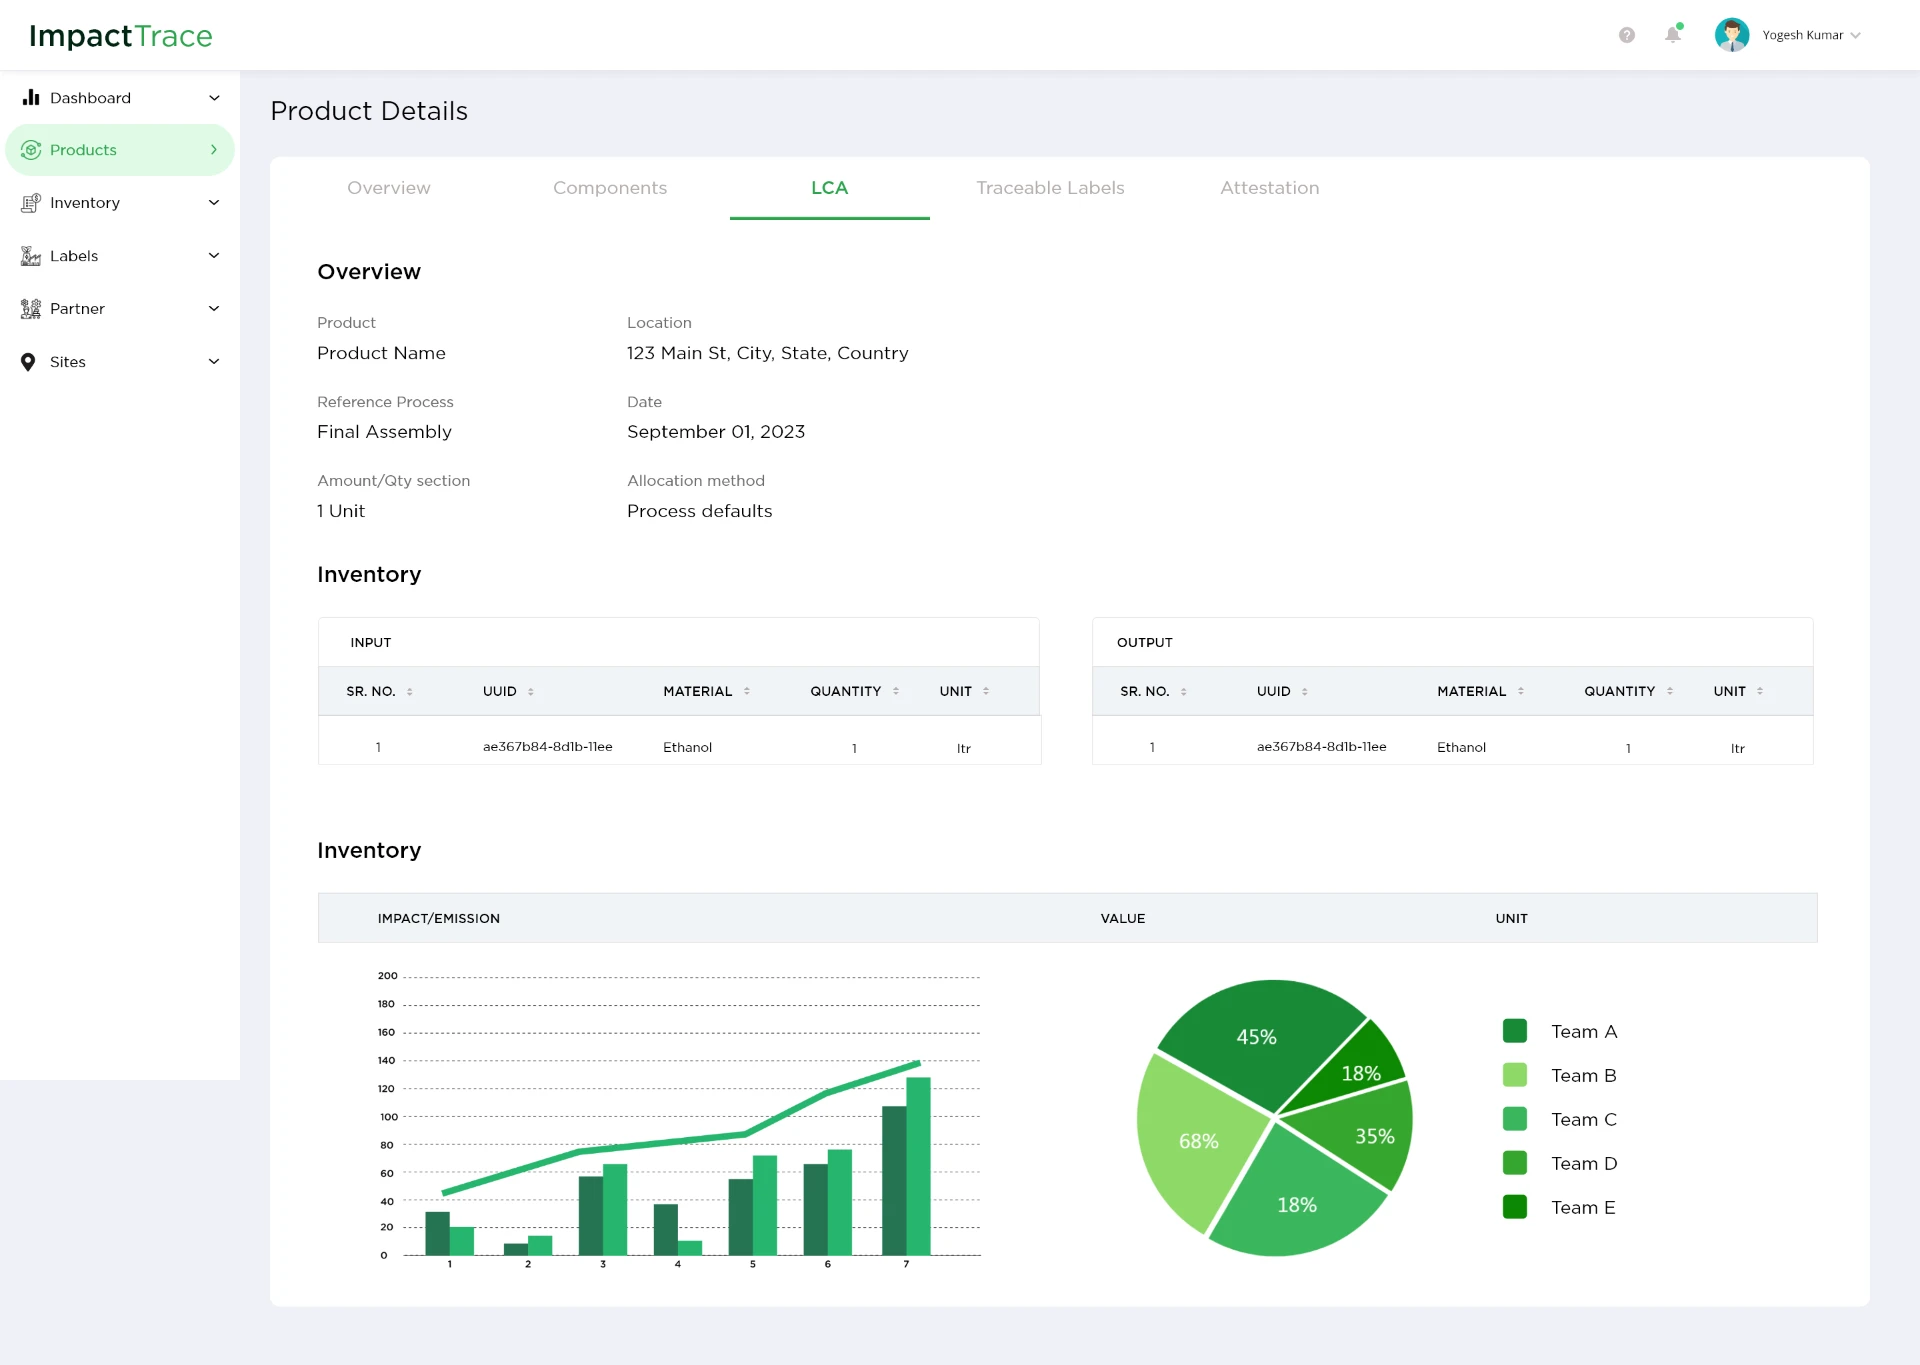
LCA output is scientific — UUIDs, acidification, DCB-eq, MJ-eq — and had to stay accurate while remaining readable to non-specialists.
Inventory tables sit beside impact charts using one shared colour scale, and every emission row carries category, value and unit — specialists get precision, everyone else gets the shape of the result.
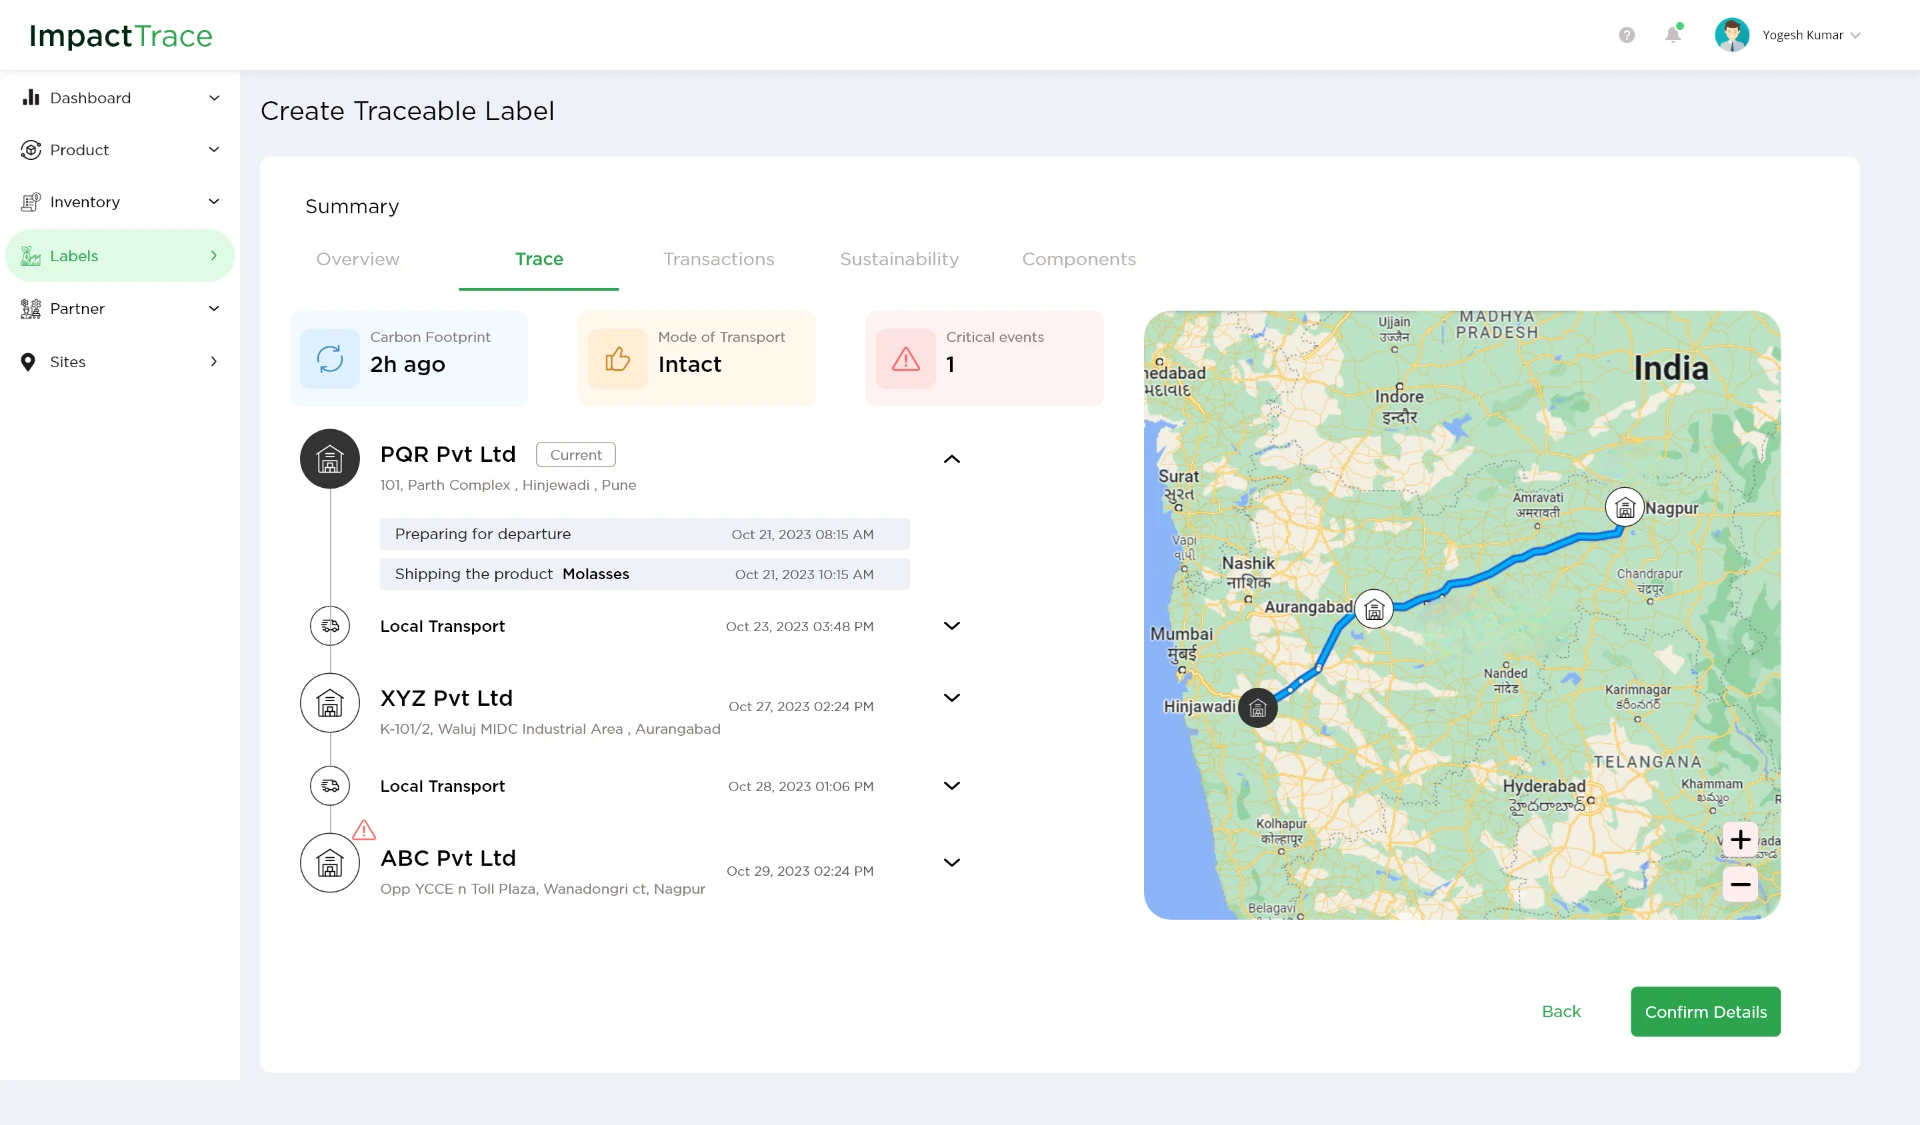
Traceability spans companies: each handover (plant, transport, warehouse) needed a timestamp, a location and an exception state without turning into a wall of logs.
Carbon footprint, transport mode and critical-event counts sit as three status cards above an expandable timeline and route map, so the health of a shipment reads in seconds and the detail is one click away.
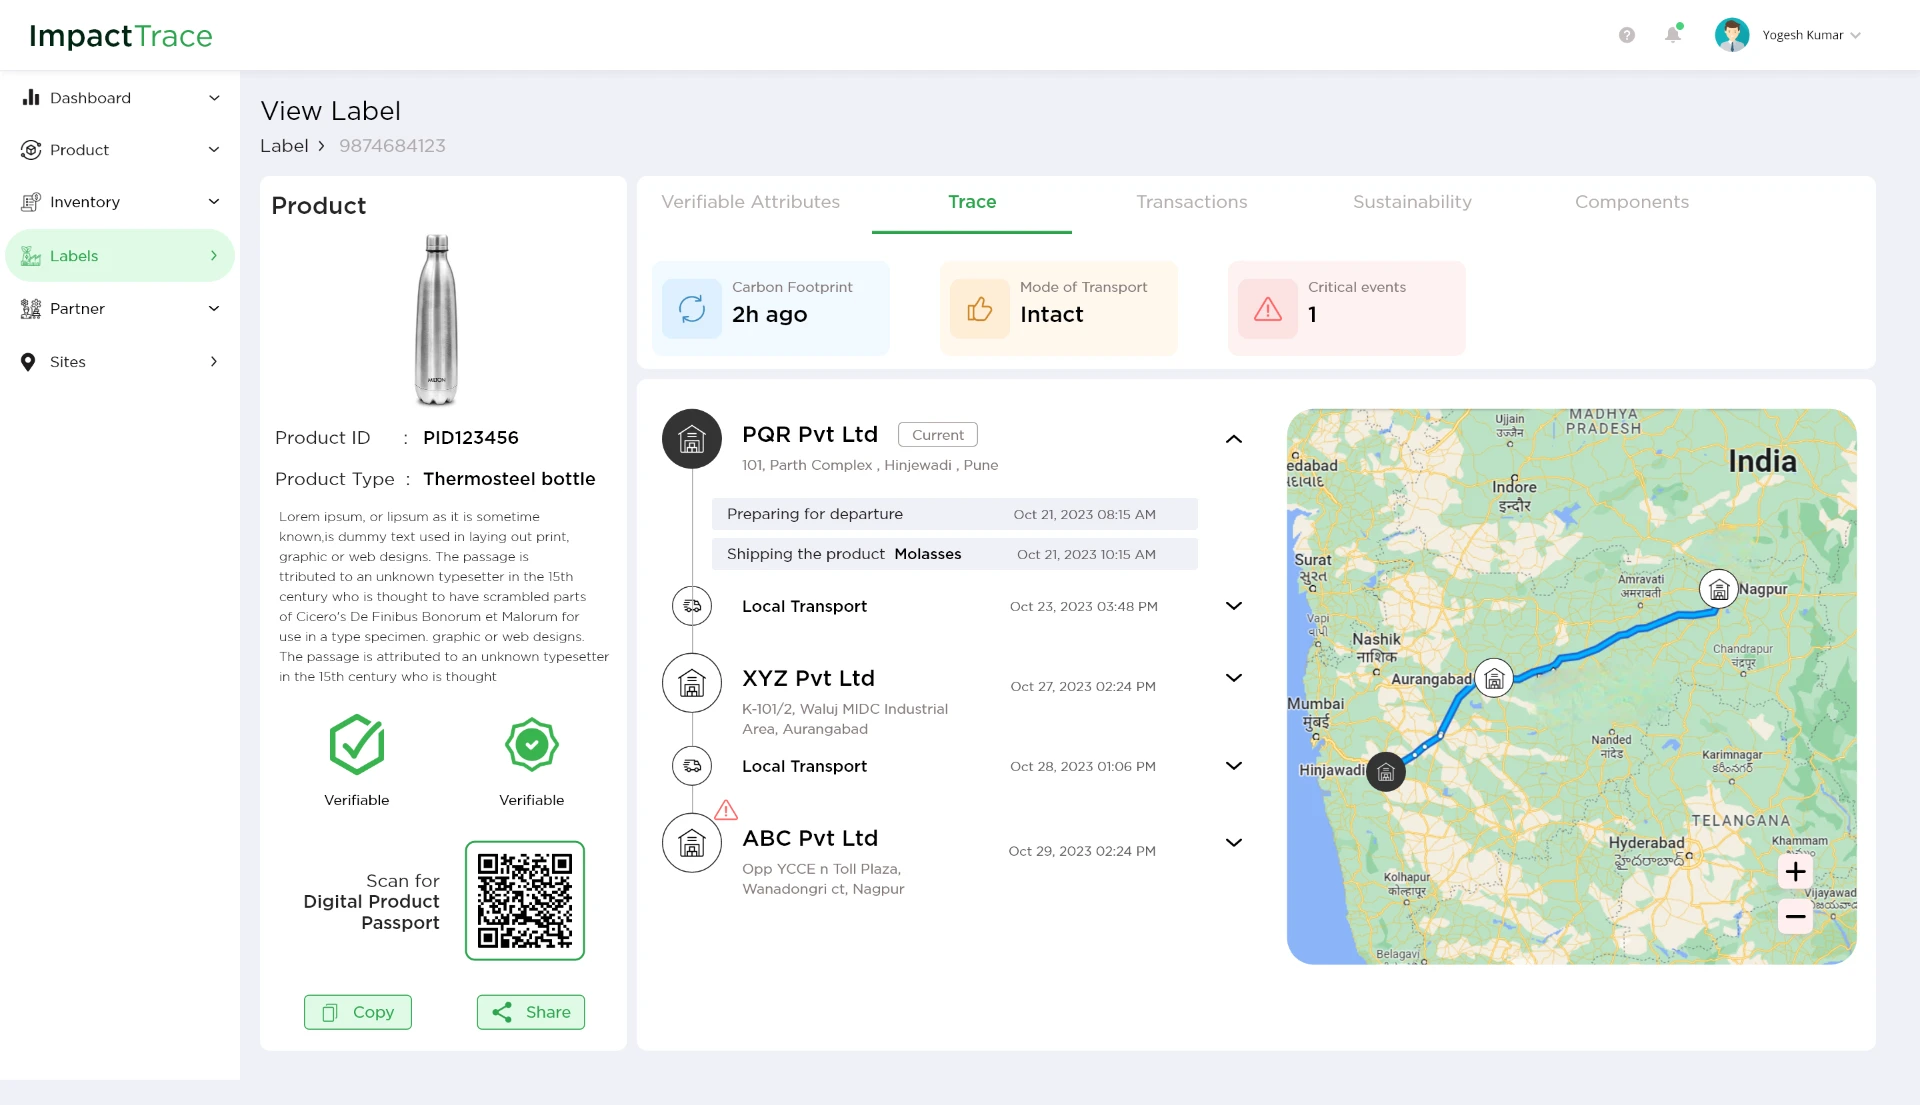
The same underlying record serves two very different audiences: an internal operator building it, and a consumer scanning a QR code.
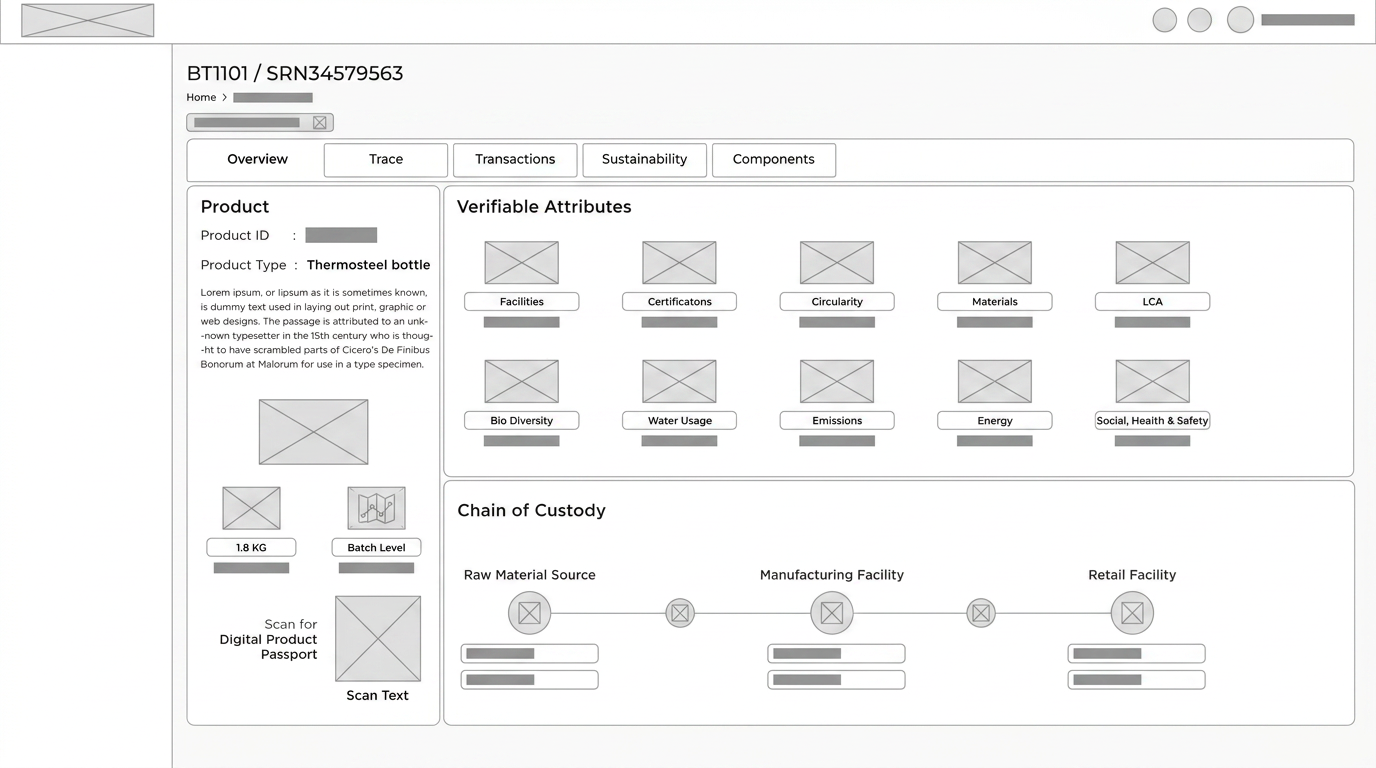
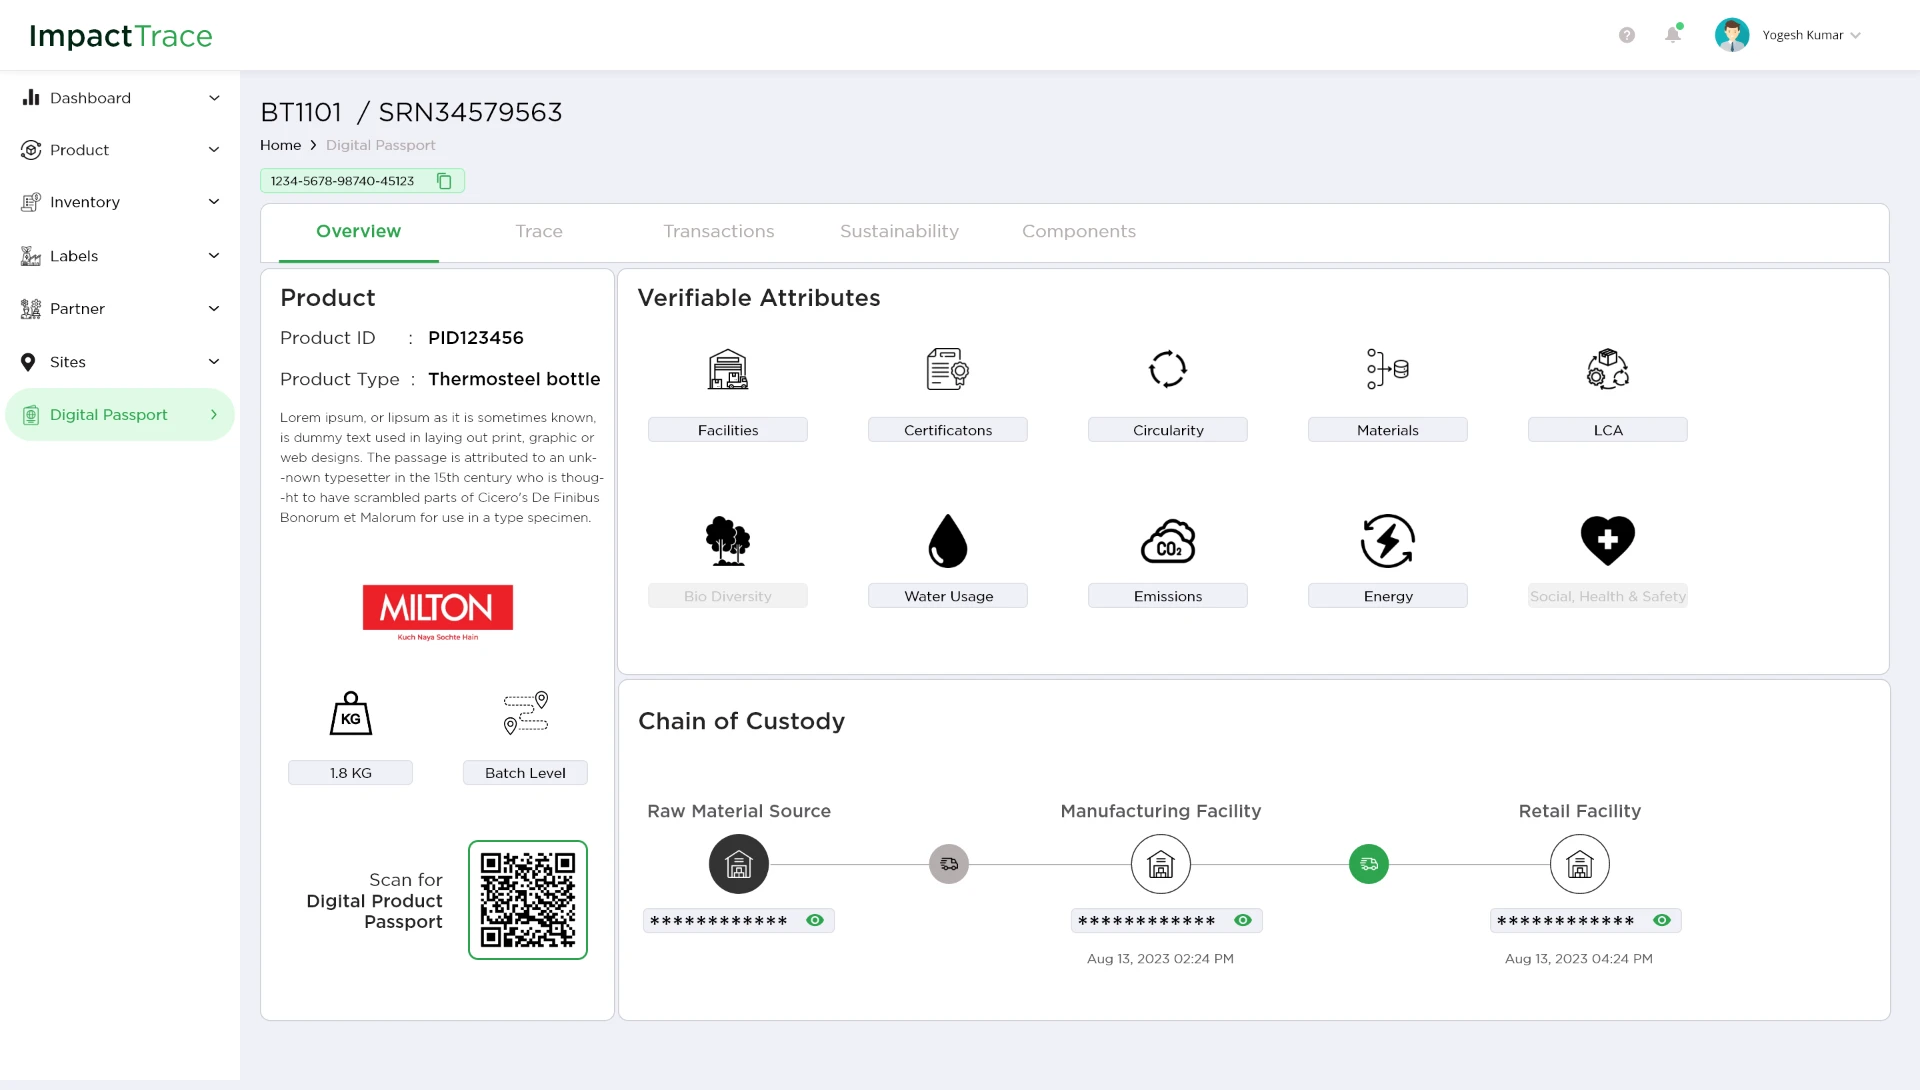
The public DPP leads with product identity, a QR code and a verifiable-attributes grid (facilities, certifications, circularity, LCA, water, emissions, energy), then shows the raw-material → manufacturing → retail custody chain with masked partner identities.
Partner data arrives incomplete, so every screen needed honest empty, pending and 'critical event' states.
Designed a wizard-based product intake (information → specification → bill of materials → LCA → traceable labels → summary), an LCA analysis view that pairs inventory tables with impact charts, and a Digital Product Passport that presents verifiable attributes, chain of custody and a scannable QR to end consumers.
05
Design process
01
Progressive-disclosure IA
Broke product creation into six ordered steps — Product Information, Specification, Bill of Materials, LCA Details, Traceable Labels, Summary — with a persistent stepper, per-step save, and a final Summary that recaps everything under tabs before submission.
02
Designing the LCA language
Worked with the analyst to standardise how impact is expressed: paired Input/Output inventory tables with an Impact Analysis table and charts, always showing category, value and unit together so a number never appears without its scale.
03
Trace as a timeline + map
Prototyped custody as a vertical timeline of facilities and transport legs, each expandable to its own events, mirrored by a route map. Critical events surface as an inline warning marker rather than a separate alerts inbox.
04
Digital Product Passport
Designed the consumer-facing view as a two-column read: product identity and QR on the left, verifiable attributes as an icon grid on the right, with unverified attributes visibly greyed out instead of hidden — proof of what is *not* claimed matters as much as what is.
06
Validation & handoff
Validation & handoff
Tested the create-a-label flow with eight operators, tightened the Bill of Materials and slot-heavy steps, then handed off in Dev Mode with table density rules, chart specs and WCAG AA contrast checked across the green palette.
07
Final UI / key screens
08
Outcome & reflection
Documented project outputs
- 6 → 1 — Data domains in one guided flow
- 8 — Operators tested with
- 1 — Unified chart & table system
- QR — Public passport per batch
In traceability products, trust is built by what you refuse to imply. Greying out unverified attributes and marking a critical event inline made the platform feel more credible than any amount of polish on the verified path — users believed the green checks precisely because the gaps were visible.